
Successful business strategies arise from simplifying complex situations into simple recommendations.
Companies that can cut through the noise, see connections, and make decisions based on real data insights are more likely to succeed in a global competition.
In this blog post, we will continue our Competitive Intelligence series and describe how Competitive Intelligence can be organized and assisted when analyzing the Autonomous Vehicle competition in China. A basic and first run of the Intelligence Cycle shows how quickly you can get foreign language information with our solution.
The Idea of Intelligence Collection and Processing
Governments have long understood the need for intelligence-backed decisions. They invest billions of dollars in research and analysis, collecting, processing and connecting data on a massive scale, informing policy and making strategic/tactical decisions. To guide the route between asking a question and answering it, a standardized process has been introduced a long time ago: the Intelligence Cycle.
It was while building tools for various communities world-wide and understanding their daily challenges that we saw the potential to apply the same ideas to the private sector as well. In our first article on Competitive Intelligence, we summarized all the key facts.
The result of this is our Intelligence Platform. It combines Federated Search, Data Fusion Platform, translation, and Natural Language Processing (NLP) to produce Enterprise Knowledge Graphs covering any topic, for any audience, on-demand.
It empowers businesses to ask complex and nuanced questions, scours the open and dark web for relevant information, and follow the Intelligence Cycle in an agile way to refine it into decision-making insights.
Let’s take a look at an example.
First, the Intelligence Cycle
Before we dive into the Intelligence Platform, we should define the Intelligence Cycle.
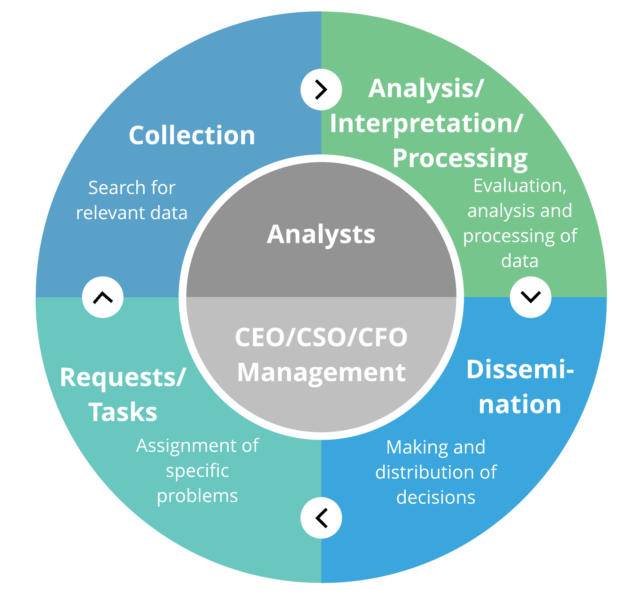
It’s a 4-stage loop, widely used in government and law enforcement circles, to answer complex questions quickly and methodically:
- Requests/Tasks: A stakeholder asks a complex question – What is the strategy of our competition in South-Korea? Are there any new technologies planned? How does the Autonomous Vehicle competition in China look like?
- Collection: Gathering data and information from all relevant sources, including Open-Source Intelligence (OSINT) from the surface, deep and dark web.
- Processing: Collating and transforming raw data into a standardized format, ready for analysis.
- Analysis/Interpretation: Interpreting the processed data to understand its implications.
- Dissemination: Communicating the newly-found insight back to people and teams who asked the original question.
With the final dissemination, new questions are raised or clarification is required. The Intelligence Cycle starts again, refining the intelligence further. This process can be applied to various use cases and it gives us a perfect fundament for traceability, audit mechanisms and oversight.
If you are interested in more information on the Intelligence Cycle and the various ways to live it, we can recommend the book Intelligence Analysis: A Target-Centric Approach by Robert M. Clark.
Understanding the Autonomous Vehicle Competition in China
The Autonomous Vehicle (AV) market is an area of rapid innovation. Each car manufacturer wants to gain an advantage. To do that, they need to answer a lot of questions, about competitors and products, customers and markets.
China is a particular hotbed of activity. The Chinese car market is already the world’s largest, and the Chinese government has committed to intelligent, and autonomous, vehicles in a number of their ‘five-year plans’ – adapting their regulations accordingly. Deloitte believes the autonomous vehicle market there will be worth $2.3 billion by 2030.
As a result, R&D cash for AV projects has flowed into China. Businesses worldwide use the country as a testing ground for self-driving cargo trucks, robotaxis, and driverless cars.
The world’s car manufacturers are watching, so let’s put ourselves in their position and start with Autonomous Vehicle competition. Let’s see how we could use our Intelligence Platform, and its various visualizations, to monitor the Chinese Autonomous Vehicle (AV) market.
Step 1: Setting a Direction
Understanding the Autonomous Vehicle competition is a complex question. But to start simple and explain the basic idea, we’ll need to ask a question. This could be something fairly specific, like
“How common are accidents involving Tesla, WeRide, or AutoX robotaxi vehicles in China?”
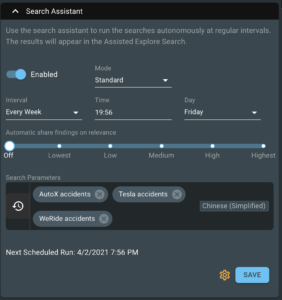
The analyst just needs to define a set of semantic, geographic, or text-based queries within the platform as shown in the following screenshot. There is no need to enter the keywords in Mandarin, as the system will take care of it in the background.
Step 2: Collection
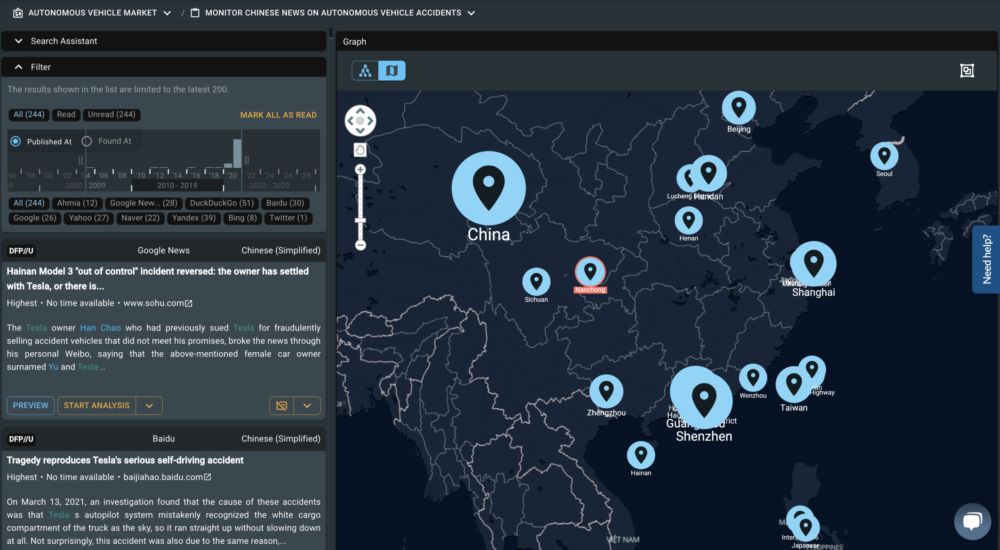
Based on the queries defined in our tasks, the platform starts a Federated Search call, scouring the surface and deep web for relevant data. Smart AI-based algorithms optimize, translate and extend the queries too, meaning a single search returns relevant related results from 100+ languages. In contrast to some other CI tools available, our system really digs the deep web and not only some RSS feeds.
Step 3: Processing
Once the Federated Search is complete, a range of algorithms and processes adds context and clarity:
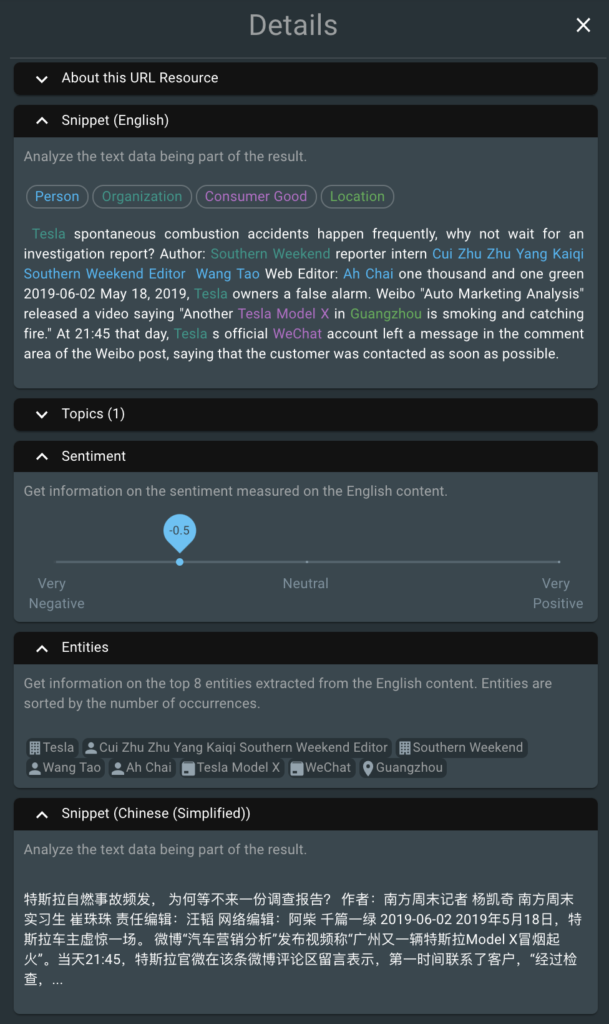
- Natural Language Processing structures and categorizes the content, identifying objects, people, businesses, places, and other entities.
- Entity resolution mechanisms remove duplicates and merge similar results
- Graph and semantic algorithms identify relationships between data points.
- Context-specific algorithms rank the content by relevance and importance.
- Sentiment analysis determines whether the content returned is negative, positive, or neutral.
- Geocoding converts the given text into geo coordinates to the map visualization.
All of this happens in the background within a few seconds before the analyst even sees the results of the query. This processing optimizes the efficiency of analysts when working on the task Autonomous Vehicle competition in China.
Step 4: Analysis
This is where things start to get really exciting. The power of Federated Search, AI, NLP, a graph database – and plenty of other clever back-end technologies – leaves us with a custom knowledge graph dataset, ready to explore.
Knowledge graphs are tools to understand related knowledge and information. Visualizing them is a great way to quickly and intuitively get a clear insight into complex situations.
With support from our partner Cambridge Intelligence, we could integrate one of the most powerful graph visualizations for web-based applications. Here’s our knowledge graph for the query ‘autonomous vehicles accident’:
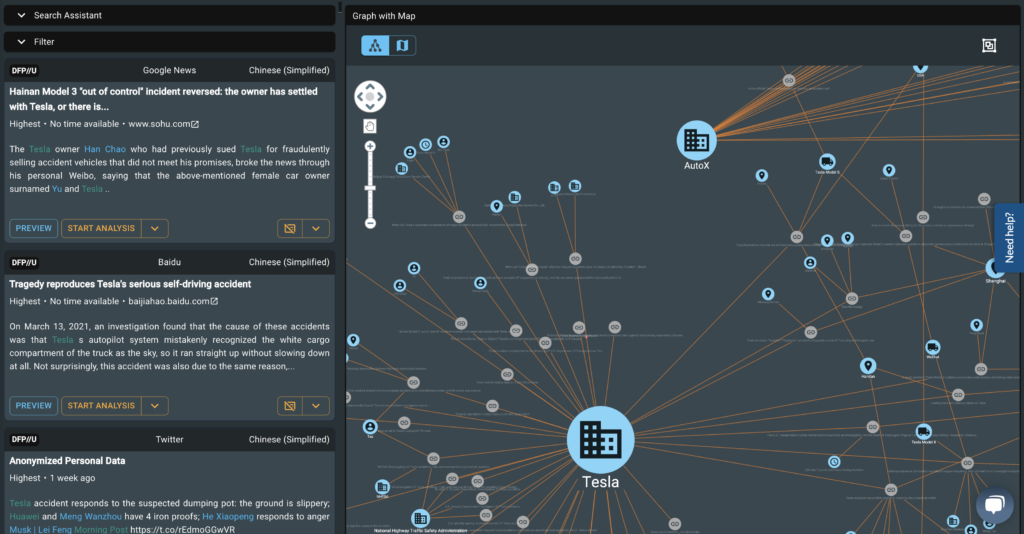
The NLP algorithms have identified entities in the data and semantically linked them ready for visualization within the graph. By applying the degree centrality measure, nodes are highlighted based on the number of connections.
One organization, in particular, stands out to us: Tesla
They are taking a leading role in autonomous driving research and design and have invested heavily in China, so we already expected to see the name more frequently in the results. According to our first shot, Tesla is mentioned more often when it comes to accidents compared to AutoX or even WeRide.
When reading the first findings on the left-hand side it also appeared that Tesla findings are really negative:
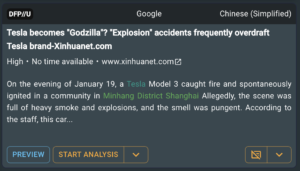
To get a better understanding of this situation, we applied a graph node grouping based on the sentiment. This gives us a chance to easily distinguish positive, neutral, and negative findings.
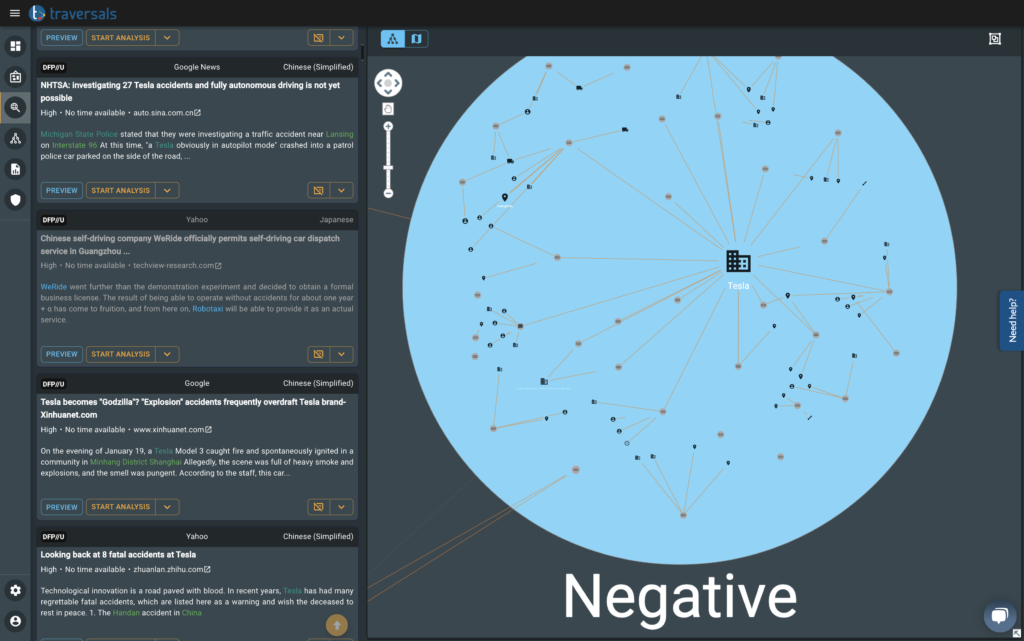
In a few clicks, we got an interactive overview of all findings grouped by their sentiment. The screenshot above shows the cluster for negative results and the Tesla organization being part of it. AutoX and WeRide were both parts of the neutral cluster.
This result really surprised us, as one gets the impression that either the Chinese reporting is biased or that Tesla is really that bad compared to its competitors.
Both options give us some first insights into the Chinese Autonomous Vehicle competition. According to the Intelligence Cycle, these insights are now summed up and forwarded to the stakeholders, and based on their feedback new actions are triggered:
- Automation of this research to get continuous information.
- Creating new research tasks, e.g. analyzing time constraints.
- Identifying key players in marketing campaigns.
- …
If you are interested in the use case Autonomous Vehicle competition or in the solution itself, get in contact with us!
Key Findings
- The Intelligence Cycle is a good process to organize the Competitive Intelligence workflow from questions to answers.
- It took us not more than 5 minutes to set up the search and to get the first valuable insights into a foreign language.
- Artificial Intelligence and Natural Language Processing is the key to analyzing huge amounts of unstructured data.